This final conclussions lesson can be accomodated to the last 10 to 15 minutes of a lesson.
Considerations about Fourier series and Spectrum
Decomposition of Functions
The underlying idea behind series is to decompose a sum of simpler functions. If we sum all the obtained sinusoidal functions, we get a function of the same shape.
Linear Combination of Frequencies
When calculating the Fourier series development of a periodic function in time, we are actually presenting this time function as a linear combination of its frequency components, i.e., we are expressing this function through its spectrum.
Discrete Spectrum
We also note that periodic signals have discrete frequency components: the fundamental frequency and multiples of the fundamental frequency. Thus, the spectrum is not a continuous curve, but it exists only at certain discrete frequency values. Consequently, it is called a discrete or line spectrum.
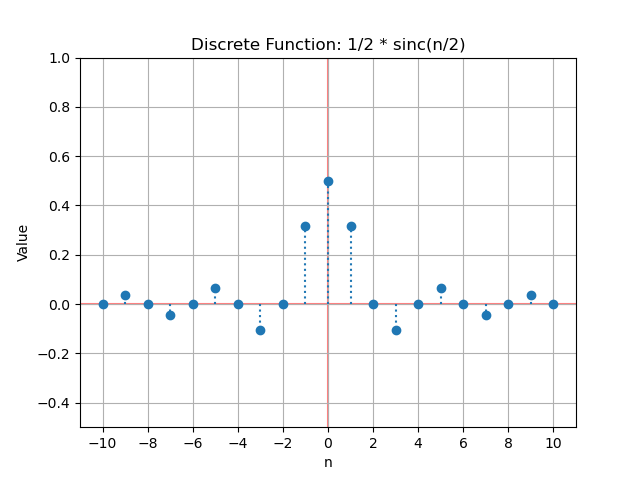
Figure shows the spectrum of the signal $f(x) from the first example pulse train. Composed of the coefficients $d_n=\frac{1}{2} \frac{\sin(\pi n/2)}{\pi n/2}$. In this figure, the horizontal axis represents the frequencies $nf_0$ and the vertical axis represents the amplitudes of these components.
Complex-Valued Spectrum
The spectrum does not necessarily consist of real values; it can be imaginary or complex. In this case, it is necessary to present it using two graphs, typically one for the magnitude and another for its phase.
Consider the coefficients of the zero-mean square wave periodic signal from figure from bipolar pulse train.
The coefficients $d_n$ are expressed by: \begin{equation} d_n = \frac{\pi n}{2j} sinc_n^2\left( \frac{n}{2} \right) = -j \frac{\sin^2(\pi n/2)}{\pi n/2} \end{equation}
Magnitude and phase
Separated into magnitude and phase: \begin{equation} \left| d_n \right| = \frac{\sin^2(\pi n/2)}{\pi |n| /2} \end{equation} \begin{equation} arg(d_n) = \begin{cases} \pi/2, \quad n<0 \ \pi/2, \quad n>0 \end{cases} \end{equation}
Graphical representation of magnitude and phase of a signal
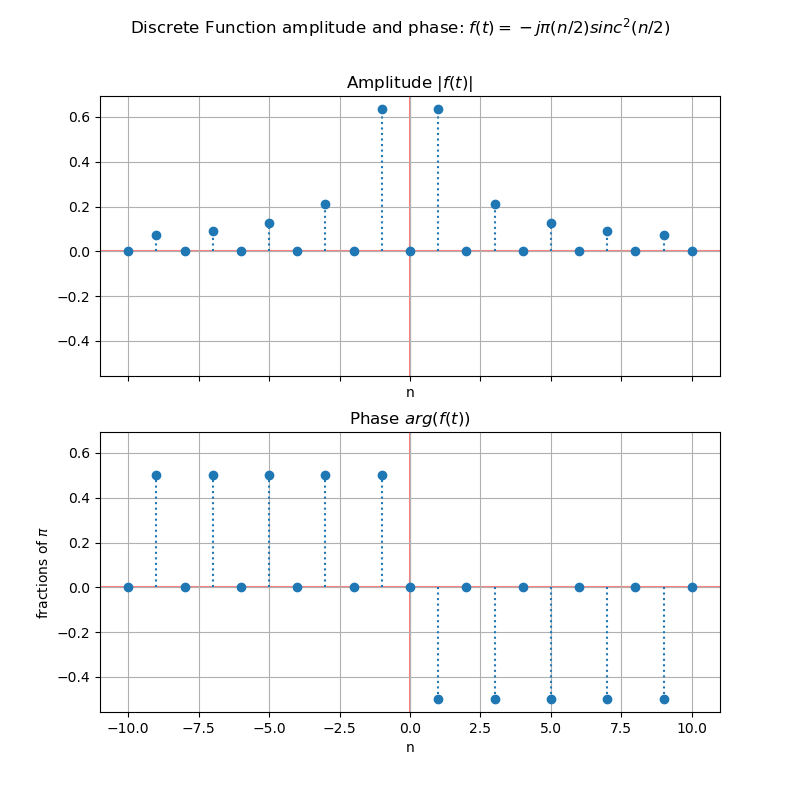
The graphs in figure illustrate this situation. The horizontal axis represents the frequencies $nf_0$ and the vertical axis represents the amplitudes of these components.
Symmetry in Spectrum Magnitude
Note that the spectrum of any real signal, such as those in the previous exercises, will always have symmetry with reference to zero frequency, meaning it will be an even function and its phase will be odd.
Effective width and density of Spectrum
The effective width of the generating signal of a periodic function represents the range of values for which the function value is non-zero. For example, in a pulse train, the effective width is the pulse width, while the period can extend as much as desired and represents the zero value of the function before the next pulse. A notable fact is that if the period increases relative to the effective width of the generating function of the periodic signal, the spectrum density increases.
Bandiwth of spectrum
Bandwidth is related to the frequency spectrum needed to generate a signal. In real life, it is limited and costly, so one must decide what type of signal will be sufficient for a purpose. For example, in digital electronics, it is not necessary to generate perfect pulse signals to discern between two logical values.
In out Fourier series examples pulse train and bipolar pulse train. , bandwith is represented by the amount of coefficients $d_n$ used to reconstruct the original signal.